Strategy Tester Report
AlpariUK-Demo (Build 225)
| Symbol | EURUSD (Euro vs US Dollar) | ||||
| Period | 1 Hour (H1) 2009.11.02 00:00 - 2009.11.27 22:00 (2009.11.01 - 2009.11.30) | ||||
| Model | Every tick (the most precise method based on all available least timeframes) | ||||
| Parameters | Lots=1; Slippage=3; Magic=20051006; LngPeriod=20; ShtPeriod=10; Entry_Stop=50; | ||||
| Bars in test | 1478 | Ticks modelled | 734909 | Modelling quality | n/a |
| Mismatched charts errors | 378 | ||||
| Initial deposit | 10000.00 | ||||
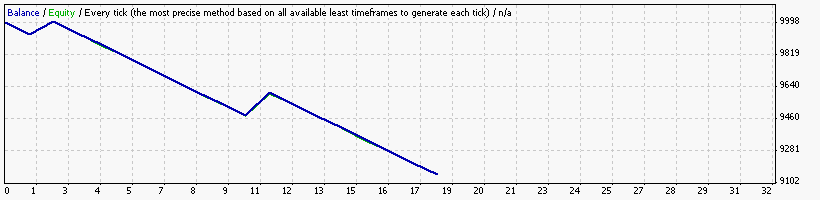
| Total net profit | -853.00 | Gross profit | 203.00 | Gross loss | -1056.00 |
| Profit factor | 0.19 | Expected payoff | -47.39 | ||
| Absolute drawdown | 853.00 | Maximal drawdown | 1777.00 (16.27%) | Relative drawdown | 16.27% (1777.00) |
| Total trades | 18 | Short positions (won %) | 8 (12.50%) | Long positions (won %) | 10 (10.00%) |
| Profit trades (% of total) | 2 (11.11%) | Loss trades (% of total) | 16 (88.89%) | ||
| Largest | profit trade | 130.00 | loss trade | -66.00 | |
| Average | profit trade | 101.50 | loss trade | -66.00 | |
| Maximum | consecutive wins (profit in money) | 1 (130.00) | consecutive losses (loss in money) | 8 (-528.00) | |
| Maximal | consecutive profit (count of wins) | 130.00 (1) | consecutive loss (count of losses) | -528.00 (8) | |
| Average | consecutive wins | 1 | consecutive losses | 5 | |
| # | Time | Type | Order | Size | Price | S / L | T / P | Profit | Balance |
| 1 | 2009.11.02 00:40 | sell | 1 | 1.00 | 1.47029 | 1.47095 | 0.00000 | ||
| 2 | 2009.11.02 00:42 | s/l | 1 | 1.00 | 1.47095 | 1.47095 | 0.00000 | -66.00 | 9934.00 |
| 3 | 2009.11.03 10:27 | sell | 2 | 1.00 | 1.47264 | 1.47330 | 0.00000 | ||
| 4 | 2009.11.03 20:03 | modify | 2 | 1.00 | 1.47264 | 1.47191 | 0.00000 | ||
| 5 | 2009.11.03 20:05 | s/l | 2 | 1.00 | 1.47191 | 1.47191 | 0.00000 | 73.00 | 10007.00 |
| 6 | 2009.11.04 13:06 | buy | 3 | 1.00 | 1.47726 | 1.47660 | 0.00000 | ||
| 7 | 2009.11.04 13:16 | s/l | 3 | 1.00 | 1.47660 | 1.47660 | 0.00000 | -66.00 | 9941.00 |
| 8 | 2009.11.05 14:43 | buy | 4 | 1.00 | 1.49080 | 1.49014 | 0.00000 | ||
| 9 | 2009.11.05 14:43 | s/l | 4 | 1.00 | 1.49014 | 1.49014 | 0.00000 | -66.00 | 9875.00 |
| 10 | 2009.11.06 14:50 | sell | 5 | 1.00 | 1.48207 | 1.48273 | 0.00000 | ||
| 11 | 2009.11.06 14:51 | s/l | 5 | 1.00 | 1.48273 | 1.48273 | 0.00000 | -66.00 | 9809.00 |
| 12 | 2009.11.09 03:50 | buy | 6 | 1.00 | 1.49138 | 1.49072 | 0.00000 | ||
| 13 | 2009.11.09 03:51 | s/l | 6 | 1.00 | 1.49072 | 1.49072 | 0.00000 | -66.00 | 9743.00 |
| 14 | 2009.11.10 06:09 | sell | 7 | 1.00 | 1.49685 | 1.49751 | 0.00000 | ||
| 15 | 2009.11.10 06:25 | s/l | 7 | 1.00 | 1.49751 | 1.49751 | 0.00000 | -66.00 | 9677.00 |
| 16 | 2009.11.11 09:01 | buy | 8 | 1.00 | 1.50168 | 1.50102 | 0.00000 | ||
| 17 | 2009.11.11 16:35 | s/l | 8 | 1.00 | 1.50102 | 1.50102 | 0.00000 | -66.00 | 9611.00 |
| 18 | 2009.11.12 10:04 | sell | 9 | 1.00 | 1.49523 | 1.49589 | 0.00000 | ||
| 19 | 2009.11.12 11:24 | s/l | 9 | 1.00 | 1.49589 | 1.49589 | 0.00000 | -66.00 | 9545.00 |
| 20 | 2009.11.13 18:09 | buy | 10 | 1.00 | 1.49131 | 1.49065 | 0.00000 | ||
| 21 | 2009.11.13 18:11 | s/l | 10 | 1.00 | 1.49065 | 1.49065 | 0.00000 | -66.00 | 9479.00 |
| 22 | 2009.11.16 00:34 | buy | 11 | 1.00 | 1.49390 | 1.49324 | 0.00000 | ||
| 23 | 2009.11.16 10:00 | modify | 11 | 1.00 | 1.49390 | 1.49340 | 0.00000 | ||
| 24 | 2009.11.16 13:00 | modify | 11 | 1.00 | 1.49390 | 1.49420 | 0.00000 | ||
| 25 | 2009.11.16 14:00 | modify | 11 | 1.00 | 1.49390 | 1.49520 | 0.00000 | ||
| 26 | 2009.11.16 14:30 | s/l | 11 | 1.00 | 1.49520 | 1.49520 | 0.00000 | 130.00 | 9609.00 |
| 27 | 2009.11.17 13:15 | sell | 12 | 1.00 | 1.48799 | 1.48865 | 0.00000 | ||
| 28 | 2009.11.17 14:00 | s/l | 12 | 1.00 | 1.48865 | 1.48865 | 0.00000 | -66.00 | 9543.00 |
| 29 | 2009.11.18 15:37 | buy | 13 | 1.00 | 1.49717 | 1.49651 | 0.00000 | ||
| 30 | 2009.11.18 15:51 | s/l | 13 | 1.00 | 1.49651 | 1.49651 | 0.00000 | -66.00 | 9477.00 |
| 31 | 2009.11.20 01:23 | buy | 14 | 1.00 | 1.49290 | 1.49224 | 0.00000 | ||
| 32 | 2009.11.20 01:26 | s/l | 14 | 1.00 | 1.49224 | 1.49224 | 0.00000 | -66.00 | 9411.00 |
| 33 | 2009.11.23 04:57 | buy | 15 | 1.00 | 1.49437 | 1.49371 | 0.00000 | ||
| 34 | 2009.11.23 04:59 | s/l | 15 | 1.00 | 1.49371 | 1.49371 | 0.00000 | -66.00 | 9345.00 |
| 35 | 2009.11.24 06:40 | sell | 16 | 1.00 | 1.49372 | 1.49438 | 0.00000 | ||
| 36 | 2009.11.24 11:09 | s/l | 16 | 1.00 | 1.49438 | 1.49438 | 0.00000 | -66.00 | 9279.00 |
| 37 | 2009.11.25 07:20 | buy | 17 | 1.00 | 1.49976 | 1.49910 | 0.00000 | ||
| 38 | 2009.11.25 07:30 | s/l | 17 | 1.00 | 1.49910 | 1.49910 | 0.00000 | -66.00 | 9213.00 |
| 39 | 2009.11.26 13:43 | sell | 18 | 1.00 | 1.50521 | 1.50587 | 0.00000 | ||
| 40 | 2009.11.26 13:45 | s/l | 18 | 1.00 | 1.50587 | 1.50587 | 0.00000 | -66.00 | 9147.00 |